White Mountains Insurance (WTM) filed a form S-4 with the Securities and Exchange Commission (SEC) last Tuesday, stating that Ray Barrette, the Chief Executive Officer (CEO) bought 2,000 shares of the company stock at prices between $441.52 and $445.
On June 17, 2008, WTM held its annual analyst meeting and Barrette indicated that the company would resume its stock buyback program, or as he called it an "allowance from the board" since he considered the stock attractive at this level ($450 range).
The last reported tangible book value of WTM was $443 at the end of the first quarter (3/31/08).
I am going through the WTM analyst meeting web cast and will post my thoughts on it shortly.
WTM is trading at its lowest price to book since the late 1990's.
Disclosure - I am long WTM.
Monday, June 30, 2008
WTM Insider Buy
Sunday, June 29, 2008
The Dividend Investing and Value Network (DIV-Net)
It is with great pleasure that I, and the collective membership, announce the debut of The Dividend Investing and Value Network (DIV-Net).
The Stock Market Prognosticator is proud to be a charter member of this new investing network focusing on dividend investing, value investing and a long-term buy and hold philosophy.
The authors of The DIV-Net want this new network to be the premier destination for readers interested in a variety of investing topics, stock analysis, and perspectives that might otherwise be found fragmented across the web. The DIV-Net is a unique network providing exclusive, original, and unpublished content daily from a growing network containing the best authors in the field. Seven Core Members are responsible for maintaining and administering The DIV-Net site and the DIV-Net network.
Our Core Members include:
Dividends4Life
The Dividend Guy
Dividend Growth Investor
the moneygardener
Stock Market Prognosticator
The Div Guy
Disciplined Approach to Investing
Here at DIV-Net we believe strongly in the virtues of our dividend investing, value investing and a long-term buy & hold philosophy and we'll not limit DIV-Net to just seven Core Members. In our aim to include as many bloggers interested in our core focus we created an Associate Membership. Associate Members are eligible to submit original unpublished articles to The DIV-Net, access to use DIV-Net's content on their site, participate in the aggregated feed and a site listing on The DIV-Net's Associates page.
Our Associate Members include:
Living Off Dividends and Passive Income
Old School Value
The Dividend Investing Blog
Triaging My Way To Financial Success
Dividend Money
In addition, DIV-Net sponsors a weekly carnival titled "Investing Carnival." The carnival's focus is on Value Investing, Dividend Investing and Long-term Buy-and-Hold Investing, as well as categories for real estate, commodities and other alternative investments. We welcome your relevant articles. To participate please submit your article here no later than 5:00 PM ET each Sunday. The Carnival will post every Tuesday. If you are interested in hosting, please e-mail dividendgrowthinvestor [AT] gmail [DOT] com.
At The DIV-Net we are dedicated to providing the best independent and original dividend, value, and a buy-and-hold investing content available on the web. We strive to bring these views together in one community focused on the highest quality membership of authors available. It is our hope that publishing, reading, following, and participating in The DIV-Net will pay long-term dividends for all involved.
Join us at The DIV-Net, and see what all the excitement is about!
Friday, June 27, 2008
Japan Export Slowdown
Japan just released its May trade surplus report, and although it beat expectations, it was down for the third straight month, hurt by rising prices for the Oil that Japan imports.
While exports to China and the rest of Asia were strong, analysts said the gain was a little deceptive, as shipments to China were artificially boosted after the recent earthquake on May 12.
Even more important was that:
1) Exports to the U.S. fell 9.5% as demand for Japanese cars and other products slowed.
2) Exports to Europe were down for the first time in 31 months.
Is this more evidence that the decoupling theory is not valid? Last week it was reported that exports from Singapore to the developed world were down as well.
Here is a list of important questions to answer:
Is it possible that the economic recession in the U.S will lead to a decline in Consumer spending on discretionary items?
Is it possible that this decline in consumer spending will be exacerbated by the increasing price of gasoline and food?
Is it possible that some Asian economies, who are heavily dependent on exports, will not be able to export as much as in the past because there aren't as many buyers?
Is it possible that these Asian economies will not grow as fast as in previous years or as much as the market or pundits expect?
Is it possible that when these Asian economies don't grow as fast, they will use less energy (oil) than the market expects?
Is it possible that the supply and demand fundamentals for oil will not meet the market expectations and we will have a surplus of oil over the next 12 months leading to a rapid rise in inventories?
Is it possible that I am out of my mind?
Thursday, June 26, 2008
More Demand Destruction
Another example of Demand Destruction due to high oil prices. A little dated perhaps, but I was at the beach all last week.
The latest “Traffic Volume Trends” report for April 2008 from the Federal Highway Administration (FHWA) shows that Americans drove 1.4 billion fewer highway miles in April 2008 compared to April 2007. The report said that vehicle miles traveled (VMT) on all public roads for April 2008 fell 1.8 percent as compared with April 2007 travel.
All regions fell, except for the Northeast. The Northeast has the lowest amount of driving, maybe due to the proliferation of mass transit in many of the urban areas, and the smaller amount of square miles in the region.
West - down 2.8%
North Central - down 2.1%
Northeast - Up 1.4%
South Gulf - down 1.5%
South Atlantic - down 2.6%
By State the biggest declines were:
Florida - down 3.5%.
Vermont - down 4.1%.
Minnesota - down 4.1%.
North Dakota - down 4.5%.
South Dakota - down 4.8%.
Idaho - down 5.3%.
So basically, Americans are driving the same amount of miles they drove in June 2005. It would seem that demand is elastic in the long term after all.
Wednesday, June 25, 2008
Legend Homes
Legend Homes filed for bankruptcy protection on June 10 in U.S. Bankruptcy Court in Oregon. Legend was a small private builder, with only 770 lots owned, and its woes will not have a major effect on the Housing situation.
However, there was an article a couple of weeks ago in Builder Magazine, that shed some detail on the causes of the filing.
One interesting fact was that Legend Homes had a positive net worth when it filed. The court papers list $258 million in assets and $198 million in liabilities. Of course the asset value may have been stale at the time of the filing. Also, Jim Chapman, the president of Legend Homes, said in the article that the company was current with all loan payments to banks. So why am I writing about this? Chapman went into detail about how Key bank, one of Legend's lenders, tried to squeeze the company to put up more collateral:
"He points specifically to Key Bank, from which Legend has borrowed $22.3 million. Chapman says that Key attempted to use an earlier margin call to coerce cross-collateralization. “They wanted to take 100 percent of the closings on homes they didn’t even have construction loans for,” says Chapman. “And their approach has been to reappraise the land, say ‘here’s the margin’ and then ‘please remit $9 million.’ They’ve been very difficult.”
I assume this same thing could happen to a major publicly traded builder as well. Could this trip housing down even further? What if thousands of lots were forced onto the market suddenly? Just something to think about.
Tuesday, June 24, 2008
Commercial Real Estate Price Crash?
The crash in Residential Housing is an old story by now, and there is no point in beating a dead horse. Our focus now turns toward Commercial Real Estate (CRE). There have been recent media reports on prices starting to decline in CRE in the United States, and battle lines are starting to form on these assets with the main question being - will CRE be the next to crash? If you put aside the hyperbole and emotional rhetoric involved with his question, it should be easier to analyze since CRE should be valued based on cash flows mostly.
Most pundits claim that what happened to Residential Housing won't happen to CRE. They give various reasons for this:
1) There was no overbuilding in CRE.
2) Lending standards were not degraded in CRE.
3) Investors here are more sophisticated (my favorite).
The purpose of this article is not to argue the above points. Let's just say that greed and stupidity, which are what created the lax lending standards that are the root of our current housing problems, are universal concepts that are not restricted to those who didn't go to college or don't know their way around a net present value calculation. (OK, forgive me, I just refuted point 3 above)
This article will focus on the theoretical components that make up the capitalization rate that is used in the CRE market to demonstrate that CRE prices must decline, possibly to a level that might constitute a "crash" to some.
The capitalization rate, for those who don't follow CRE, is defined mathematically as the net operating income (NOI) of a property divided by its value or price. NOI is calculated before debt service. An example should suffice in explaining this concept:
Property A has a NOI of $10,000 a year, and sells for $200,000, then the capitalization rate would be 5%.
This is used as a proxy for the yield or return of a property. It is also used to compare to observable capitalization rates in the market. Current capitalization rates for all classes (office, retail, industrial, multi family) of CRE are very low on a historical basis. In some desirable areas, capitalization rates reached a low of 5%. This was because of low interest rates and the ubiquitous "liquidity" arguments that used to make me nauseous in 2006 and 2007 as I read them. I wasn't blogging during this liquidity tsunami, but if I was, I would have titled my post:
"Field of Dreams Investments - if you create an investment, they will buy it, don't worry."
The capitalization rate has four theoretical components, according to current academic research
1) Expected Inflation - investors in any asset require protection from the ravages of inflation. This is usually expressed as "expected inflation" not actual reported inflation. Surveys show that inflation expectations are rising. This is being fed by media reports about commodity and food inflation. For the purposes of this article, I will not argue whether the commodity boom is real and long lasting. What matters is what expectations are.
2) Real Return - what an investor expects to earn on his capital. We assume that this component is stable.
3) Risk Premium - investors rightly expect to be compensated for the risk they take by investing in Real Estate, as opposed to a risk free asset. There are some who claim that there is little risk in investing in real estate. I remember a sell side REIT analyst marketing back in 2005 who made the extraordinary claim that "REIT's are so safe that trust departments are substituting them in the place of treasuries in customer accounts."
After I finished hyperventilating and coughing extra loud for effect, I interrupted him to tell him that I had worked in a trust department at a bank for four years, and that if I had suggested to the Chief Investment Officer that we swap REIT's for U.S. Treasury notes, I would have been tarred and feathered. He then furiously backpedaled, we all laughed around the table, and began to pick at our food. Sorry for the digression, but the point is that this risk premium will almost certainly increase over the absurdly low levels of the last few years as CRE fundamentals deteriorate.
4) Recapture Premium - this component compensates investors for the physical deterioration of the asset throughout its life. Again, we assume that this remains stable.
Mathematically, therefore, this is how it works:
Our previous example above
Property A has a NOI of $10,000 a year, and sells for $200,000, then the capitalization rate would be 5%.
If the capitalization rate is impacted as I describe:
Property A has a NOI of $10,000 a year, and the Capitalization Rate demanded is 7% - then the market price would be $142,000. This is a drop of 29%.
An even worst case scenario is if NOI falls:
Property A has a NOI of $9,000 a year, and the capitalization rate demanded is 7% - then the market price would be $128,000. This is a drop of 36%.
I know there are those who will scoff at this academically based argument. If you are one of those people, then search on Google for charts on historical capitalization rates for CRE. It wasn't too long ago that these rates were in the high single digits. A two percentage point increase may not be all that unreasonable.
So what you are seeing in CRE currently, in regard to the the slowdown in sales, is not just the result of a lack of financing, or the shutdown of securitization markets, although both these reasons are valid; but the main cause of the slowdown in sales is the fundamental financial canyon, so to speak, between buyers and sellers of CRE, with buyers demanding a higher capitalization rate to be compensated for an increased risk premium and an increased expected inflation premium. Sellers haven't broken down and accepted this yet.
The acceptance of this will be accelerated during the year as cash flows decline in CRE due to increased vacancies, lower rents, and the economic downturn. As more distressed sellers are forced to liquidate at lower prices, capitalization rates will move higher.
Monday, June 23, 2008
Quote of the Day - June 23, 2008
"My basic message to those who say that prices have to go up forever is that the oil markets have been cyclical for 140 years. Why should that have stopped?" says Edward Morse, chief energy economist at Lehman Brothers.
Wednesday, June 18, 2008
Next Up China?
Singapore Exports Fall as Western Demand Ebbs
WSJ
By JOHN JANNARONE
June 18, 2008
SINGAPORE -- Exports from Singapore in May fell the most in more than two years as shipments to the U.S. and Europe tumbled, highlighting the island state's exposure to weaker demand from Western developed economies....Nonoil domestic exports fell 9.8% in May from April in seasonally adjusted terms....Shipments to Western countries were much weaker in May, and healthier demand from Singapore's Asian trading partners wasn't sufficient to keep overall exports afloat.
Decoupling theory may you rest in peace.
Tuesday, June 17, 2008
Oil and the Great Deception - Part Three
"Oil Production in the United States is in a permanent decline."
This is one of the loudest of all claims by oil bulls, and the one stated with the most smug self satisfaction, a seemingly impregnable statement that no one with even half a brain could possibly refute. This claim is usually made in conjunction with some comment about M. King Hubbert, and his prescient statement about the aforementioned peak, complete with the required head bowing and reverence for the so called "messiah" of the peak oil movement.
How can anyone deny this after all?
According to the Department of Energy web site, domestic oil production peaked in 1970, at 9.6 million barrels per day. On a Monthly basis, it peaked in November 1970, at 10.4 million barrels per day. However, this doesn’t tell the entire story.
1) Production in the U.S has stopped declining and was flat in 2007 vs. 2006. While there is some noise in the numbers due to recent hurricanes, it is estimated that in 2008, production will again be flat before a large 4.1% increase in 2009. The chart below shows the reversal in this decline.
2) During a four-year period, from 1982 to 1985, domestic production grew every year, a legacy of increased oil exploration while prices were high in the late 1970’s and early 1980’s. The total percent increase in domestic production was 4.65%.
Here is a chart from Google Docs. Although hard to see in the chart due to the scale and my technical incompetence in trying to remove the lower numbers, production did increase before tailing off once prices collapsed.
3) Domestic oil production also increased in 1977 and 1978, including a whopping 5% in 1978.
4) Domestic oil production increased 10.3% from 1976 to 1985, from 8.1 million to 8.9 million barrels per day.
5) Recently, sequential production has increased for four straight months (December 2007 to March 2008), although still down on a year over year basis. And yes, I understand that four months does not a trend make, just thought I would mention it.
Why am I wasting time writing this?
To demolish cherished beliefs held by millions of investors who rely on others to do their homework for them. Stop regurgitating what you hear on TV, and do your own god damn research.
What you should really be thinking about is that if production can actually increase in a mature basin like the United States, then imagine what could happen in areas of the world that are at the cutting edge of exploration.
Now before you your make your comments about how stupid I am or how I just don't understand, please read the following about things I am specifically not saying, so please don't accuse me of this:
1) I did not say that U.S production will ever reach its previous peak of 10.4 million barrels reached in 1970, just that production could head up again due to increased exploration.
2) I did not say that it is easier to find oil in the United States.
3) I did not say that the possibility of a small increase in production in the United States will solve all of our supply problems.
Friday, June 13, 2008
Oil and the Great Deception - Part Two
"It is getting much more expensive to find Oil these days."
While it is true that it is getting more expensive to find oil, one has to examine whether that increase is of a permanent nature as many argue. The reason that it is getting more expensive to find oil is mainly because service, drilling and other costs are sharply increasing. While this may seem like a circular argument at first, my intention is to demonstrate that the cost of finding oil is rising to a cyclical peak, and that it is not secular in nature.
All the data shows that the cost of finding Oil is rising sharply. Why? Very simply because of a self reinforcing boom in exploration and production, which led to a capacity shortage in oil services and drilling as demand for rigs and services increased faster than supply. Other costs, such as for steel, or the acquisition of existing producing properties has also increased for the same reason, a shortfall in capacity in various sectors, or an imbalance between supply and demand.
It is therefore, a cyclical increase in the cost of finding oil, not a secular or systemic one. If the exploration and production sector cuts drilling significantly, say 30-40%, then extra capacity will flood the oil services and drilling market leading to a plunge in prices and then the cost of finding and developing oil will decrease.
This argument is supported by data from many sources.
The Energy Information Administration (EIA) study entitled Oil and Gas Lease Equipment and Operating Costs, which has data from 1976 to 2006. The chart below demonstrates the cyclical nature of oil services.
Look at the green line back in the early 1980's when the cost index fell from 123.3 to 82.6 in just five years. This study does not include drilling and completion costs. If you included these, the cyclicality would be even more pronounced. Also, this data is only through 2006. The green line currently is significantly higher.
The same trend can be seen in the HS/Cambridge Energy Research Associates (CERA) Upstream Capital Costs Index. The latest monthly release from May 2008, shows that "the latest increase raised the index to 210 points from its previous high of 198. The values for the UCCI are indexed to the year 2000, meaning that a piece of equipment that cost $100 in 2000 would cost $210 today." 
This index tracks "the construction of a geographically diversified portfolio of twenty eight onshore, offshore, pipeline and LNG projects."
As an example, five years ago, it may have cost $ 250,000 per day to lease a rig to explore deep offshore. Today, if you can find one it may cost you $800,000 per day. According to Cambridge Energy Research Associates (CERA), dayrates can be 30-40% of the cost of an offshore well.
So in a sense, it is getting more expensive to find oil, but people who say this are either ignorant of the reason why or being disingenuous to further their investment case. Bullish investors use this as an excuse to justify that oil prices have to stay higher because the cost to find oil is higher.
Please understand that I am not predicting that this these various cost indices will turn down soon, only stating for the record that they can turn down, and have turned down precipitously in the past once capacity catches up to demand.
If you argue that the cost of finding Oil is permanently higher, then you are accepting the argument that industries that have been intensely or even pathologically cyclical for 100 years are no longer subject to those conditions. This is a bold statement to make and you better be damn sure you are right.
Please read my earlier post of the fallacy of demand growth in emerging markets.
Wednesday, June 11, 2008
Oil and the Great Deception
"What matters is growth from the emerging markets, not the United States or other mature markets."
Oil Bulls love to trot out China, and to a lesser extent, India, when discussing the unbelievable growth from emerging markets. I heard a money manager call such growth "massive." Well let's see just how massive this growth is. In 2006, China consumed 7.2 million barrels a day, and in 2007 it consumed 7.58 million barrels a day. This is "astounding" growth of 380 thousand barrels a day. In 2008, the barrel per day growth is estimated to be 420 thousand barrels. While the growth rate is fairly impressive on a percent basis, the absolute increase is hardly more than a rounding error in an 87 million barrel a day market.
Now let's look at the "mature" markets that don't matter. Demand from the 30 countries countries belonging to the Organization for Economic Cooperation and Development (OECD), was 48.96 million barrels per day in 2007. This demand has been flat for several years and is roughly the same as it was in 2003. This demand will begin to fall, as it has done in the past when oil prices reach very high levels. We have already seen evidence of this in reports on miles driven on U.S. highways which fell 4.3% in March 2008.
Let's look at what that impact will be:
OECD Demand declines one percent - 490,000 barrel per day decline.
OECD Demand declines two percent - 880,000 barrel per day decline.
As you can see, a one percent decline in demand from "mature" economies would wipe out all China's absolute growth last year. A two percent decline would be equal to twice China's barrel per day growth. So emerging markets don't really matter except in the context of the entire market. Are the OECD demand declines I listed above realistic? Yes, demand has fallen in previous years when prices were high.
Tuesday, June 10, 2008
Dear Mr. T. Boone Pickens
World oil supplies won't exceed 85 million barrels a day because of high depletion rates of existing wells, Pickens, the founder and chairman of Dallas-based BP Capital LLC, said yesterday in a speech at Georgetown University. "There is only 85 million barrels of oil globally in the market coming a day and I don't think you can increase that 85 million," Pickens said. (April 2008)
World oil supply rose to 86.6 million b/d in May, up nearly 500,000 b/d from April's 86.11 million b/d as production rose from OPEC, China and the former Soviet Union, the International Energy Agency said Tuesday. OPEC raised its crude supply to 32.31 million b/d last month, up from 31.91 million b/d in April, the IEA said in its latest monthly oil market report. (June 2008)
Thursday, June 5, 2008
One Bank Throws in the Towel
Citizens Republic Bancorp (CRBC) is a large bank in Michigan, with deposits and loans all over the Upper Midwest States, and today it announced it was raising $200 million in capital to bolster its balance sheet. The bank also announced that it was transferring $131.4 million of non performing loans in its portfolio to "held for sale," on its balance sheet. The breakdown by category is:
Land Construction and Development - $59.2 million.
Other CRE - $26.8 million.
Residential Mortgage - $45.4 million.
According to the problem bank guide published by the Office of the Comptroller of the Currency, when loans are transferred to this category, "the transfer to the HFS account must be made at the lower of cost or fair value in the period in which the decision to sell is made."
The amounts written off, and the percent when the loans were marked to market was:
Land Construction and Development - $11.60 million, or 19.6%.
Other CRE - $6.50 million, or 24.3%.
Residential Mortgage - $20.40 million, or 44.9%.
The average writedown was 29.3%.
These writedowns reflect the reality of what is occurring out there, although many banks are reluctant to take this step and write down loans. When a bank delays doing this, it gives an artificial view of of a bank's capital position. I applaud CRBC for taking the actions they did. Many other banks will follow over the next year.
CRBC also gave a forecast for the balance of 2008 on credit losses. The bank estimated net charge offs at a range of $79.0 million at the low end, up to $163.0 million in a worst case stress scenario.
The stock has had a rough last year, as can be seen in the chart below.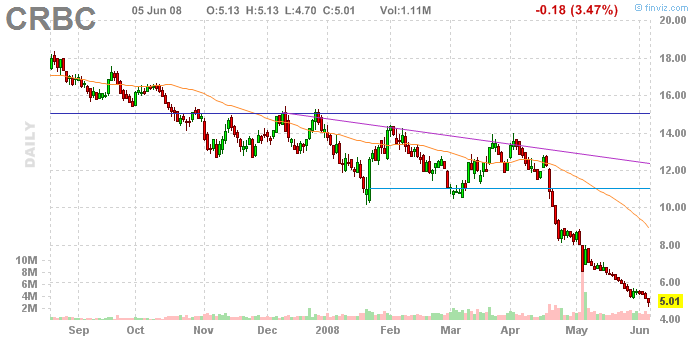
Disclosure - I am short this stock.
Wednesday, June 4, 2008
What if Hubbert Was Wrong but Nobody Cared?
It is a mantra of the Peak Oil movement that oil production in the United States peaked in the 1970’s, and that this production peak has, or soon will occur in worldwide production of oil. M King Hubbert, of course, is the prophet of this movement, his legendary status enshrined by his uncanny and correct prediction that production in the U.S would reach a peak. Hubbert, so to speak, is the “Jesus Christ” of the Peak Oil movement.
But anyway, what if Hubbert was wrong? How would that impact the Peak Oil movement, and indeed Hubberts own messianic status in that movement?
According to the Department of Energy web site, domestic oil production peaked in 1970, at 9.6 million barrels per day. On a Monthly basis, it peaked in November 1970, at 10.4 million barrels per day. However, this doesn’t tell the entire story. While it is true that domestic production has been in an inexorable decline since then, with 2007 production at 5.1 million barrels per day, the following is also true:
1) Production in 2007 was flat with 2006, the first time this happened since 1991.
2) During a four-year period, from 1982 to 1985, domestic production grew every year, a legacy of increased oil exploration while prices were high in the late 1970’s and early 1980’s. The total percent increase in domestic production was 4.65%.
3) Domestic oil production also increased in 1977 and 1978, including a whopping 5% in 1978.
4) Domestic oil production increased 8.8% from 1977 to 1985.
5) Recently, sequential production has increased for four straight months (December 2007 to March 2008), although still down on a year over year basis. And yes, I understand that four months does not a trend make, just thought I would mention it.
So why am I writing this? Two reasons:
The pundits used to say the same thing about Natural Gas production domestically – that it was impossible to increase production, that the entire country was drilled over, and that high decline rates on new discoveries would work to keep production flat or in decline forever. Well guess what? Domestic gas production as measured on a gross, marketed or net basis is rising and has been for a while.
So if we can increase natural gas production domestically, due to increased exploration and development, when new wells decline 50% after the first year, why can’t we increase domestic oil production due to increased exploration and development when decline rates are much lower?
The second reason is that I want everyone to understand that just because you hear something repeated over and over on television and on the Internet doesn’t make it true. Most of the people saying it have a financial interest in seeing it come true. Do your own research for yourself and then decide.
Now please don’t jump all over me for this article, I am not making a broad statement on the validity of Peak Oil, just the narrow point that domestic oil production can, and has increased during a long term decline, and that this can impact supply and therefore the price of Oil. OK, that’s it. Let the name-calling and data mining begin.
Tuesday, June 3, 2008
White Mountains Insurance (WTM) Analyst Day
I just wanted to remind everyone that White Mountains Insurance (WTM) is holding its 2008 Annual Investor Information Meeting on June 17 in New York City. The company has no analyst coverage that I am aware of, and doesn't market very much, so the analyst day is a fine opportunity to understand the company better. If you aren't familiar with the company, WTM is a property casualty insurance company with three main businesses:
OneBeacon
White Mountains Re
Esurance
The stock has been battered along with other financials over the last year, selling off from $611 down to a low of $449 a share. This was not the only reason it sold off, as there are issues in some of WTM's businesses that may make it harder for them to grow book value as robustly as they have historically.
If you look at the chart below, WTM looks like it has hit a technical "multiple bottom" in the $450-460 range. It has tested this level three times and bounced off of it. This is also right around its book value. Although I do not worship at the altar of technical analysis, I do recognize its value in picking entry and exit points, when fundamentals provide confirming evidence.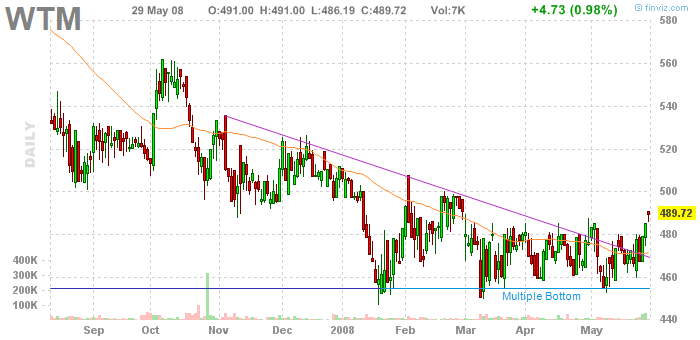
I have written on WTM previously in these posts:
White Mountains Insurance
I also posted my notes from the analyst day last year. It is a long post and is more or less a transcript of the event.
You can listen to the webcast of the event if you can't make it up to NYC on that day. The direct link is on the WTM web page.
Disclosure - I am long WTM.
Monday, June 2, 2008
First Integrity Bank
First Integrity Bank of Staples, MN failed late Friday, and its assets were sold to another bank. First Integrity was originally established in 1920, as Staples State Bank, and apparently survived the Great Depression of the 1930's.
Do not confuse this bank with Integrity Bancshares Inc., of Alpharetta, GA, which now trades on the Pink Sheets at $0.35, under the symbol ITYC.PK ITYC used to sell at $12.50 in May and voluntarily delisted from NASDAQ in May.
Anyway, here are the final stats for First Integrity Bank of Minnesota:
Assets in nonaccrual status - 9.34%.
Tier 1 risk-based capital ratio -(-0.38%). This was 5.23% three months earlier.
Total risk-based capital ratio - (-0.38%). This was 6.55% three months earlier.
All real estate loans - 33.99% (pct of total assets)
Press Release One and Two.
My previous posts on the failure of Hume Bank and ANB Financial.


